Investment in mobile advertising is growing rapidly and Google leads the pack here. The position of your ad on Google’s mobile search results is key to driving traffic from smartphone and tablet users. The average Click Through Rate (CTR) for ads in position 1 is the highest on both tablets and mobiles. However, the change in CTR as users scroll down the search results page is not uniform.
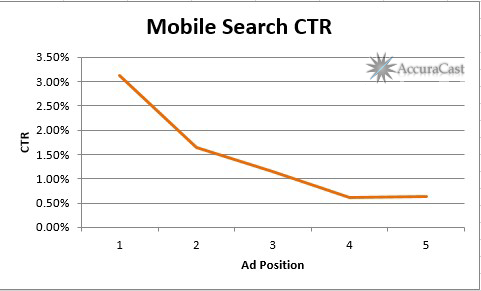
The graph above highlights the importance of occupying position 1 on mobile search. Advertisers see a huge drop in CTR for ads in position 2, 3 and 4.
Screen real estate on mobile is fairly limited. Moreover, search habits on mobile are also fairly stingy – users carry out fewer searches with less words per search and tend not to go past the first page of results. Getting the prime ad position for your target keywords is therefore crucial to driving traffic on mobile.
Average click through rates for Google mobile ads at each position from 1 (top of first page) to 5 (bottom of the first page or top of 2nd page) are listed in the table below:
| Position | Click Through Rate |
|---|---|
| 1 | 3.12% |
| 2 | 1.64% |
| 3 | 1.14% |
| 4 | 0.61% |
| 5 | 0.64% |
Comparing these click through rates for each position with CTR on desktop ads during the same time period – the last 12 months – we find that while CTR is highest for ads in position 1 on desktop and mobile, it is much lower on mobile devices and it drops off more steeply than it does on desktop search.
CTR For Search On Tablets
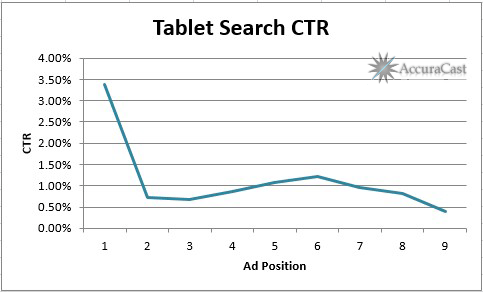
Click behaviour on tablets is even more different than desktops. Once again, the peak position is the clear winner. However, after that, click through rates seem to rise between position 4, 5 and 6 and then decrease gradually.
Position 6 sees the second-highest click through rate for search ads on tablet devices such as the iPad. Between positions 2 and 9 the CTR does not seem to change much. There are a number of theories as to why this might be the case, but it would be interesting to hear your thoughts: Why is the CTR for tablet ads relatively independent of position?
Average click through rates for Google tablet ads for each position from 1 (top of first page) to 9 are listed in the table below:
| Position | Click Through Rate |
|---|---|
| 1 | 3.39% |
| 2 | 0.72% |
| 3 | 0.68% |
| 4 | 0.87% |
| 5 | 1.07% |
| 6 | 1.22% |
| 7 | 0.96% |
| 8 | 0.82% |
| 9 | 0.39% |
Overall, both mobile and tablet devices do not seem to drive as high a percentage of clicks on ads as desktops do.
A simple explanation of this could be the user mindset when browsing on these devices, which tends to be either quick information gathering or media consumption, neither of which drive as much transactional intent as desktop searches do.
Data for this study was drawn from the analysis of over two million clicks, collected during a year-long period from advertisers across a wide variety of industries.
About the Author
Farhad is the Group CEO of AccuraCast. With over 20 years of experience in digital, Farhad is one of the leading technical marketing experts in the world. His specialities include digital strategy, international business, product marketing, measurement, marketing with data, technical SEO, and growth analytics.


