


International Growth Index
Identify Your Next Big Opportunity
Accuracast’s International Growth Index is a quarterly ranking of 248 countries and territories based on their attractiveness for international expansion.
The ranking evaluates each market across eight strategic pillars, including business readiness, purchasing power, digital infrastructure, setup friction and digital search demand. Each country is scored on 34 composite metrics, determining its potential for cross-border business growth.
Accuracast is an international marketing agency helping brands capture global market share by identifying growth opportunities. Drawing on 382,000+ data points from the IMF, World Bank, UN, ITU and Google, our data scientists and consultants created this index to provide a robust, data-driven starting point for cross-border expansion planning.
View the top 20 ranked countries, learn more about the eight pillars underpinning the ranking methodology of this index, and our data sources.

Current Top 10 Growth Markets
| Rank | Country | Score |
|---|---|---|
| 1 | Japan | 62.79 |
| 2 | Singapore | 62.13 |
| 3 | United States | 60.79 |
| 4 | Thailand | 60.19 |
| 5 | Iceland | 59.21 |
| 6 | South Korea | 57.73 |
| 7 | Italy | 57.69 |
| 8 | Ireland | 57.10 |
| 9 | Poland | 56.87 |
| 10 | Switzerland | 56.46 |
What the Index is:
Accuracast assessed 248 countries and territories, and ranked each market with data from 34 composite metrics. The International Growth Index uses the following eight pillars for evaluation:
- Digital search demand
- Purchasing power
- Market demand
- Digital readiness
- Financial infrastructure
- Regulatory complexity
- Setup cost and friction
- Cross-border activity
A number of factors contribute to the score for each pillar. These pillar scores are combined to calculate an overall score for each country. Markets with a high score typically offer a stronger combination of demand, purchasing power, digital maturity and ease of entry, making them more attractive for international growth investment.
Countries are then ranked based on their overall score. The rankings are updated quarterly, to reflect the impact of the latest socio-economic developments in each region.
Once you’ve identified potential target markets for your business, we recommend using our market entry guide to plan your go-to-market strategy.
Executive Summary
Accuracast’s International Growth Index ranks Japan first, Singapore second and the United States third for cross-border expansion, across 248 markets, combining data from sources including the IMF, World Bank’s B-READY and Google search demand and advertising costs.
The index ranks 248 markets using business readiness, purchasing power, digital infrastructure, setup friction and search demand. Compared to data from 2025, Japan stays in the lead with 62.79 points out of 100, followed by Singapore up two spots, and the United States staying steady in third place.
Japan is ranked the most attractive market for international business growth, largely due to the continued high online search demand. The country benefits from high digital search volumes per 1,000 people, with a relatively moderate degree of competition and much lower advertising costs than other comparable markets – for reference, average costs per click in the U.S. are 232% higher than in Japan.
The United States’ third-place ranking is consistent when compared to data from 2025, with an overall score that’s gone up 1.2 points in spite of economic and political changes. The current trade turbulence due to wars and tariffs seems to have little effect on the attractiveness of the U.S, as a business expansion target. It recorded some of the study’s largest search volumes, though this comes at a significant premium – the U.S. has the highest weighted advertising costs in the world. The U.S. scored highly for digital readiness (93.01) and financial infrastructure (81.18).
The United Kingdom ranked 28th in Accuracast’s International Growth Index, with a score of 54.57, despite ranking third for financial infrastructure with a score of 84.58. The U.K.’s high digital readiness score of 87.23, wasn’t sufficient to offset the hyper-competitive nature of the market, witnessed in the highest weighted competition score.
Key Takeaways
The top 5 most attractive markets for international business growth are Japan, Singapore, United States, Thailand and Iceland. None of them rank in the top 5 for any single evaluation pillar, but all of them perform consistently high or very high across all eight pillars, which makes them more attractive growth targets on the whole.
Strong digital demand in-country has offset political and economic turbulence for some of the most attractive markets.
Iceland has made it into the top 5 markets for international expansion for the first time, seeing a healthy recovery from the financial crash a decade ago.
Taiwan has seen the biggest fall in market attractiveness, dropping 33 spots to place at 35.
Brazil and Bahrain have both lost ranking, dropping to the bottom of the top 20.
Overview Of The Latest Index
Every single country ranked in the top 20 experienced positive growth in their overall score between 2025 an 2026, making this year more competitive than ever!
Rankings Table
Rank | Country | Pillar 1: Market Demand | Pillar 2: Purchasing Power | Pillar 3: Digital Readiness | Pillar 4: Financial Infrastructure | Pillar 5: Regulatory Complexity | Pillar 6: Setup Cost & Friction | Pillar 7: Digital Search Demand | Pillar 8: Cross-Border Activity | Overall Score |
|---|
| 1 | Japan | 45.41 | 63.61 | 84.58 | 68.99 | 57.26 | 38.59 | 64.43 | 59.15 | 62.79 |
| 2 | Singapore | 60.35 | 84.19 | 96.91 | 78.74 | 62.84 | 35.69 | 25.47 | 82.02 | 62.13 |
| 3 | United States | 53.39 | 71.03 | 93.01 | 81.18 | 64.5 | 27.2 | 43.46 | 69.58 | 60.79 |
| 4 | Thailand | 45.9 | 59.2 | 85.52 | 68.99 | 57.26 | 41.96 | 57.73 | 59.15 | 60.19 |
| 5 | Iceland | 55.69 | 66.59 | 85.76 | 75.98 | 56.08 | 34.58 | 59.44 | 67.9 | 59.21 |
| 6 | South Korea | 48.79 | 65.67 | 96.77 | 72.83 | 69.75 | 40.95 | 32.18 | 70.6 | 57.73 |
| 7 | Italy | 41.3 | 54.69 | 91.49 | 74 | 67.26 | 29.4 | 48.26 | 79.43 | 57.69 |
| 8 | Ireland | 47.75 | 71.07 | 90.01 | 75.26 | 61.61 | 35.23 | 29.73 | 79.99 | 57.1 |
| 9 | Poland | 41.07 | 64.81 | 89.55 | 76.72 | 59.51 | 39.79 | 38.62 | 70.52 | 56.87 |
| 10 | Switzerland | 49.25 | 70.95 | 87.85 | 68.99 | 57.26 | 34.06 | 33.37 | 59.15 | 56.46 |
| 11 | Hong Kong | 49.11 | 69.77 | 92 | 72.86 | 36.96 | 42.58 | 30.34 | 73.68 | 56.2 |
| 12 | Spain | 47.07 | 53.69 | 93.63 | 76.04 | 67.72 | 30.36 | 38.14 | 83.68 | 56.05 |
| 13 | Belgium | 48.12 | 56.71 | 88.76 | 79.9 | 64.94 | 24.83 | 38.03 | 78.28 | 55.73 |
| 14 | France | 45.63 | 54.88 | 85.87 | 68.99 | 57.26 | 37.89 | 45.94 | 59.15 | 55.61 |
| 15 | Netherlands | 52.21 | 59.28 | 87.6 | 68.99 | 57.26 | 26.5 | 39.84 | 59.15 | 55.56 |
| 16 | Bulgaria | 41.45 | 62.82 | 87.06 | 72.03 | 63.32 | 36.4 | 36.97 | 71.54 | 55.47 |
| 17 | Malaysia | 56.66 | 64.14 | 89.42 | 73.74 | 58.57 | 45.26 | 28.33 | 56.46 | 55.38 |
| 18 | Brazil | 56.61 | 56.41 | 75.78 | 62.09 | 54.03 | 40.58 | 45.53 | 53.24 | 55.35 |
| 19 | Bahrain | 69.72 | 46.3 | 95.16 | 64.55 | 59.53 | 41.33 | 32.91 | 73.21 | 55.34 |
| 20 | Norway | 49.61 | 70.9 | 88.12 | 68.99 | 57.26 | 30.52 | 29.14 | 59.15 | 55.16 |
Each pillar’s score is computed from a number of metrics and then normalised on a scale of 0-100. Pillars whose metrics with lower values are better, including regulatory complexity and setup costs, are reverse-scored. View details on the pillars and the ranking methodology.
Large populations do not guarantee a high growth ranking
Google Ads Keyword Planner recorded an estimated 67 million monthly US searches across Accuracast’s pre-defined set of search terms, spanning multiple industries, the highest total in the dataset. The US also recorded some of the highest weighted average costs per click for search advertising, at $19.09 for financial services and $21.93 for BB keywords, making it the most expensive market for search advertising in the study. This impacted the U.S. ranking negatively.
China generated an estimated 52 million monthly searches, followed by India’s 34 million, and the UK registered 13 million searches for the re-defined keyword set. Normalising for population, however, China and India report only 37 and 26 searches per 1,000 people respectively, and the UK recorded 219 searches per 1,000 people, compared with 194 in the U.S., but the U.K. also had a much higher weighted Google Ads competition score (24.5) than the USA (19.9), China (4.3) and India (12.5).
Selecting the right market for cross-border expansion is difficult. Mistakes can be costly. We strongly recommend using our Market Entry Checklist to minimise the chances of failure.
Data Visualisations
The following interactive visualisations highlight key findings from the International Growth Index, helping business leaders compare markets and explore the data on business opportunity, regulation, setup costs, digital readiness, and existing search demand.
Heatmap of Market Attractiveness
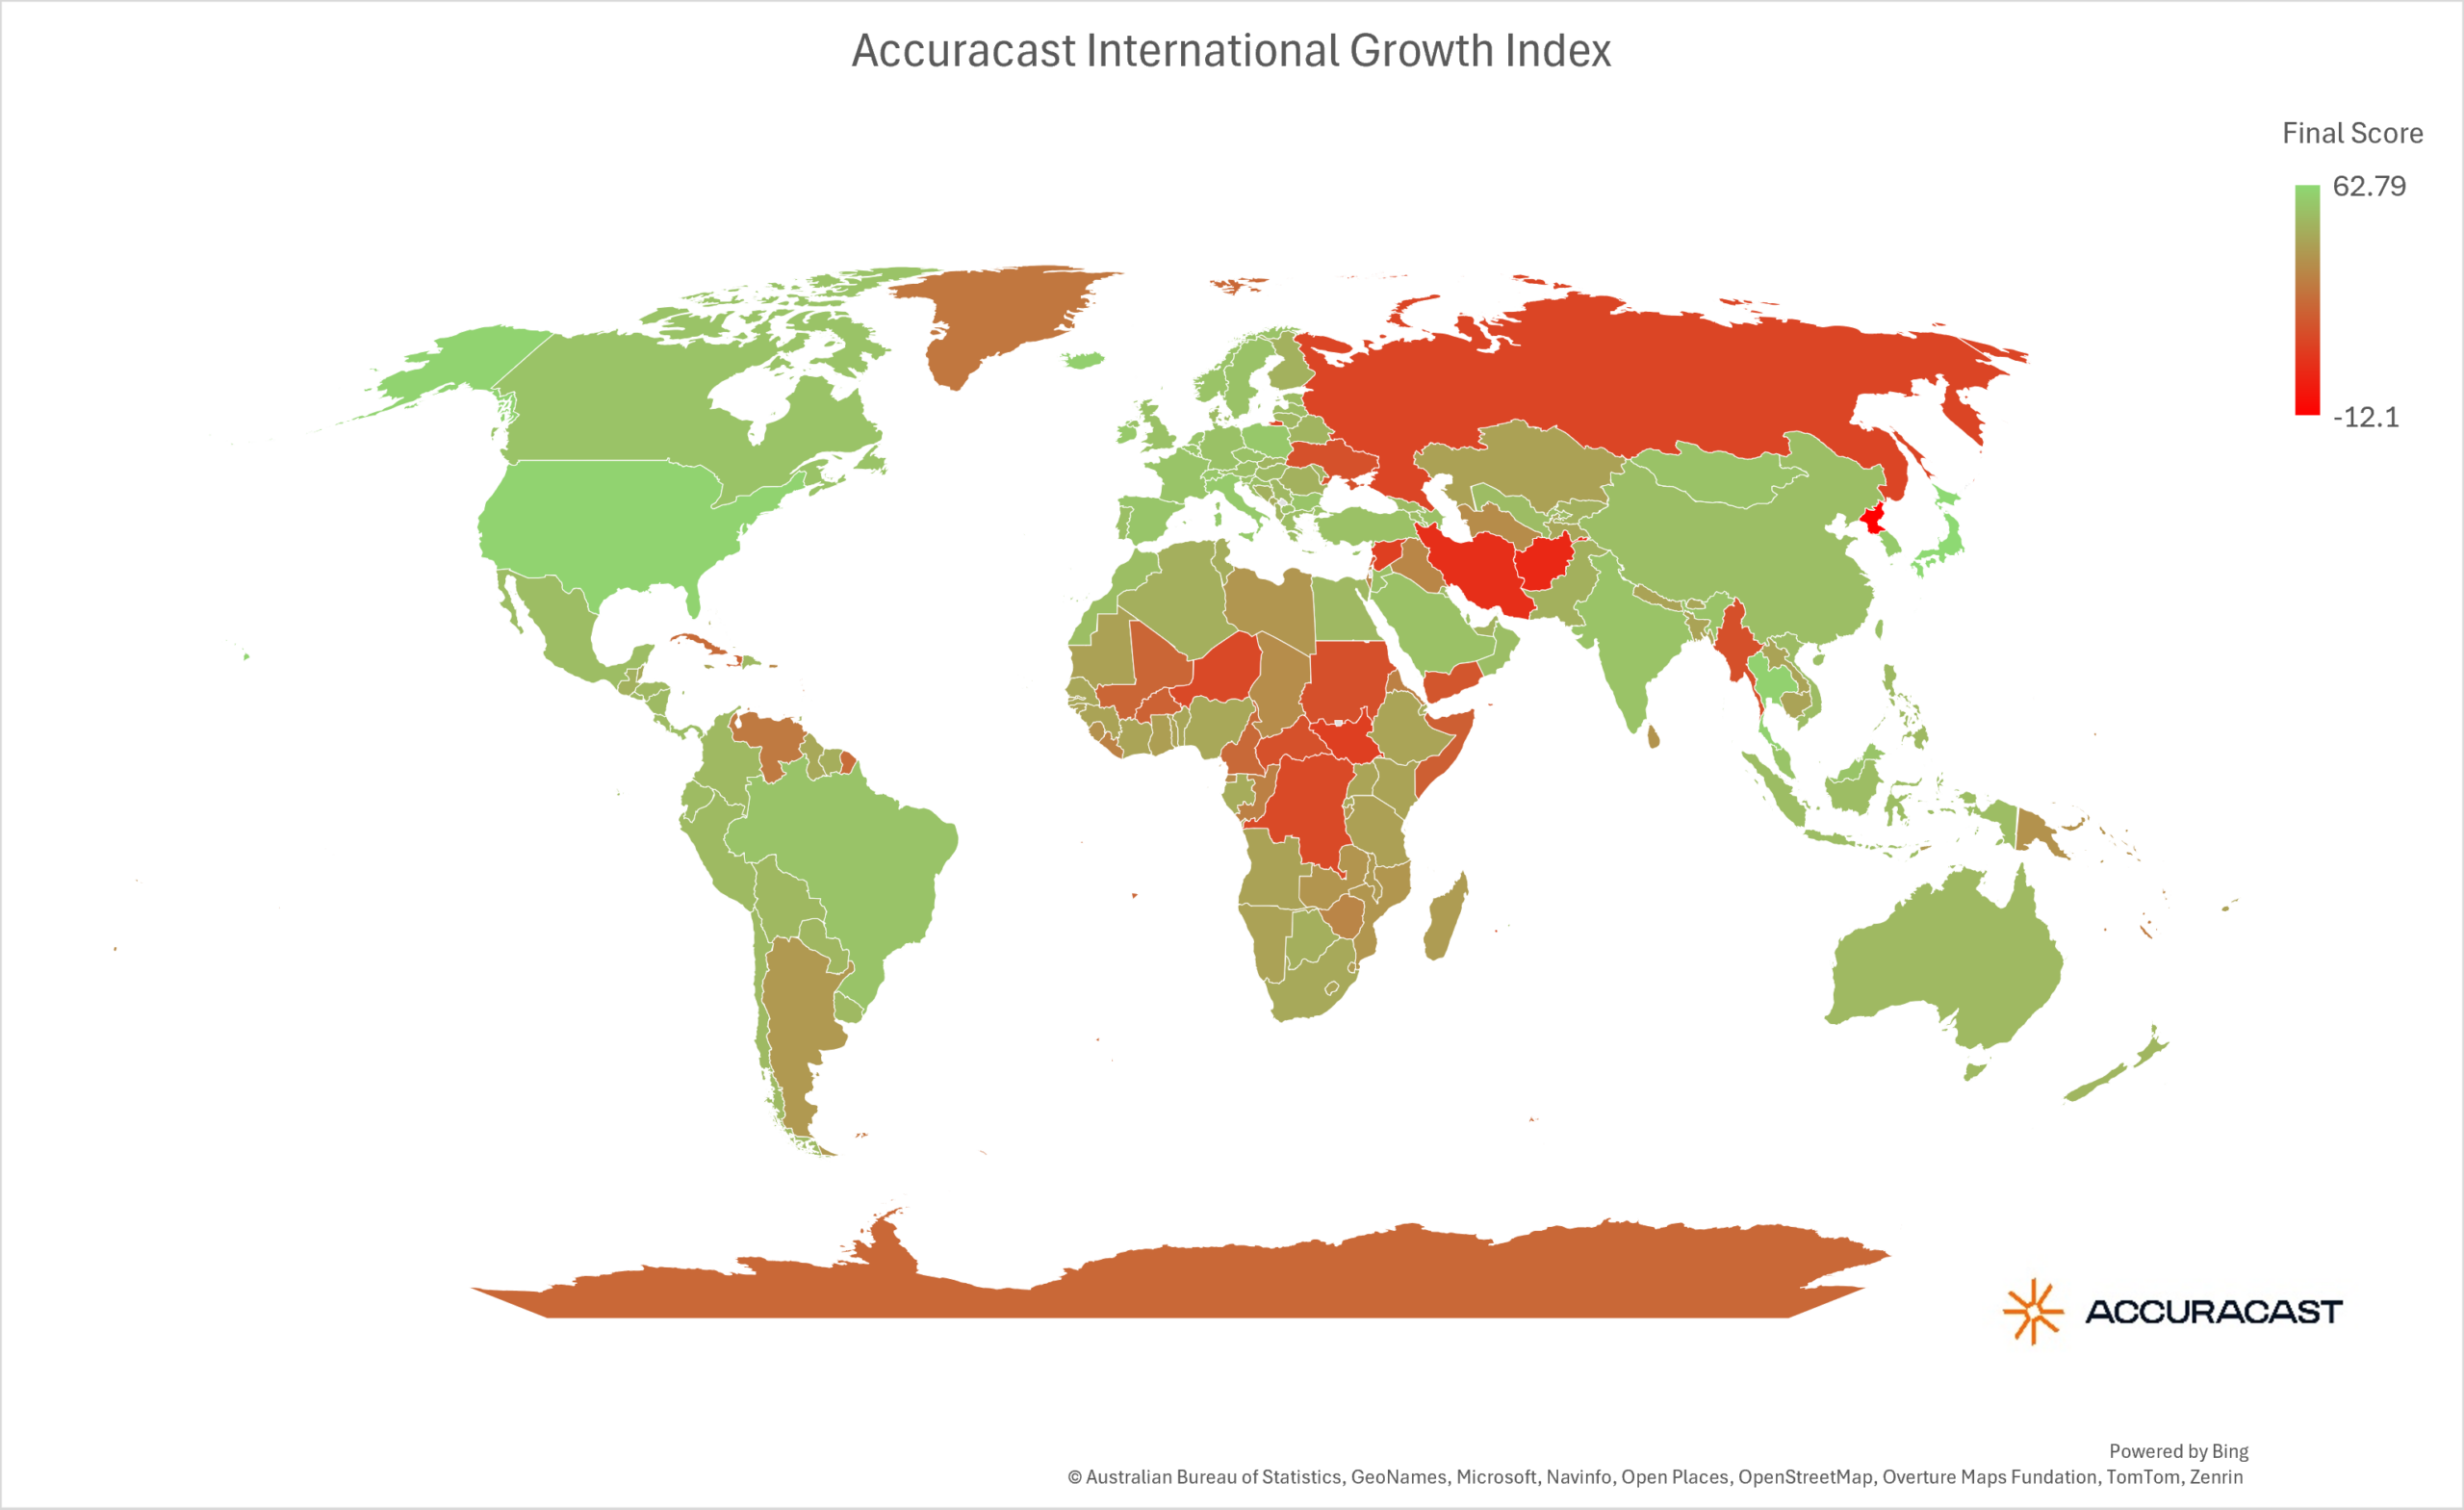
<> Embed the interactive infographic or static image on your site.
<iframe title="Accuracast International Growth Index" aria-label="Choropleth map" id="datawrapper-chart-OcGS7" src="https://datawrapper.dwcdn.net/OcGS7/9/" scrolling="no" frameborder="0" style="width: 0; min-width: 100% !important; border: none;" height="555" data-external="1"></iframe><script type="text/javascript">(function(){function e(){window.addEventListener(`message`,function(e){if(e.data[`datawrapper-height`]!==void 0){var t=document.querySelectorAll(`iframe`);for(var n in e.data[`datawrapper-height`])for(var r=0,i;i=t[r];r++)if(i.contentWindow===e.source){var a=e.data[`datawrapper-height`][n]+`px`;i.style.height=a}}})}e()})();</script><p style="font-size:13px;">Source: <a href="https://www.accuracast.com/global-growth-lab/international-growth-index/" target="_blank" rel="noopener">Accuracast International Growth Index</a></p>
<p><img src="https://www.accuracast.com/wp-content/uploads/2026/09/Accuracast-international-growth-index-scaled.png" alt="Accuracast International Growth Index — Heatmap of Market Attractiveness across 248 countries" width="800" style="max-width:100%;height:auto;" /> <p style="font-size:13px;">Source: <a href="https://www.accuracast.com/global-growth-lab/international-growth-index/" target="_blank" rel="noopener">Accuracast International Growth Index</a></p>
Light-touch Regulation
The percentage of countries that impose a low regulatory burden for business expansion in the market. These countries score over 60 on Pillar 5: Regulatory Complexity, and include South Korea, Romania, Georgia and Estonia.
Low Setup Friction
The percentage of countries that have low setup costs and make it easy for businesses to enter the market. These countries score over 40 on Pillar 6: Setup Cost & Friction, and include Malaysia, Serbia, Mexico and Vietnam.
Digital Readiness
The percentage of countries that have ‘great’ or ‘excellent’ internet penetration, 5G mobile coverage and fixed broadband affordability. These countries score over 70 on Pillar 3: Digital Readiness, and include Singapore, Bahrain, Latvia and Portugal.
Search Demand
The percentage of countries that demonstrate higher than average search volume for our benchmark keyword set. These countries search more than 11.04 times a month per 1000 people, and include Bulgaria, Spain, Italy and Sweden.
Search Demand per 1000 people
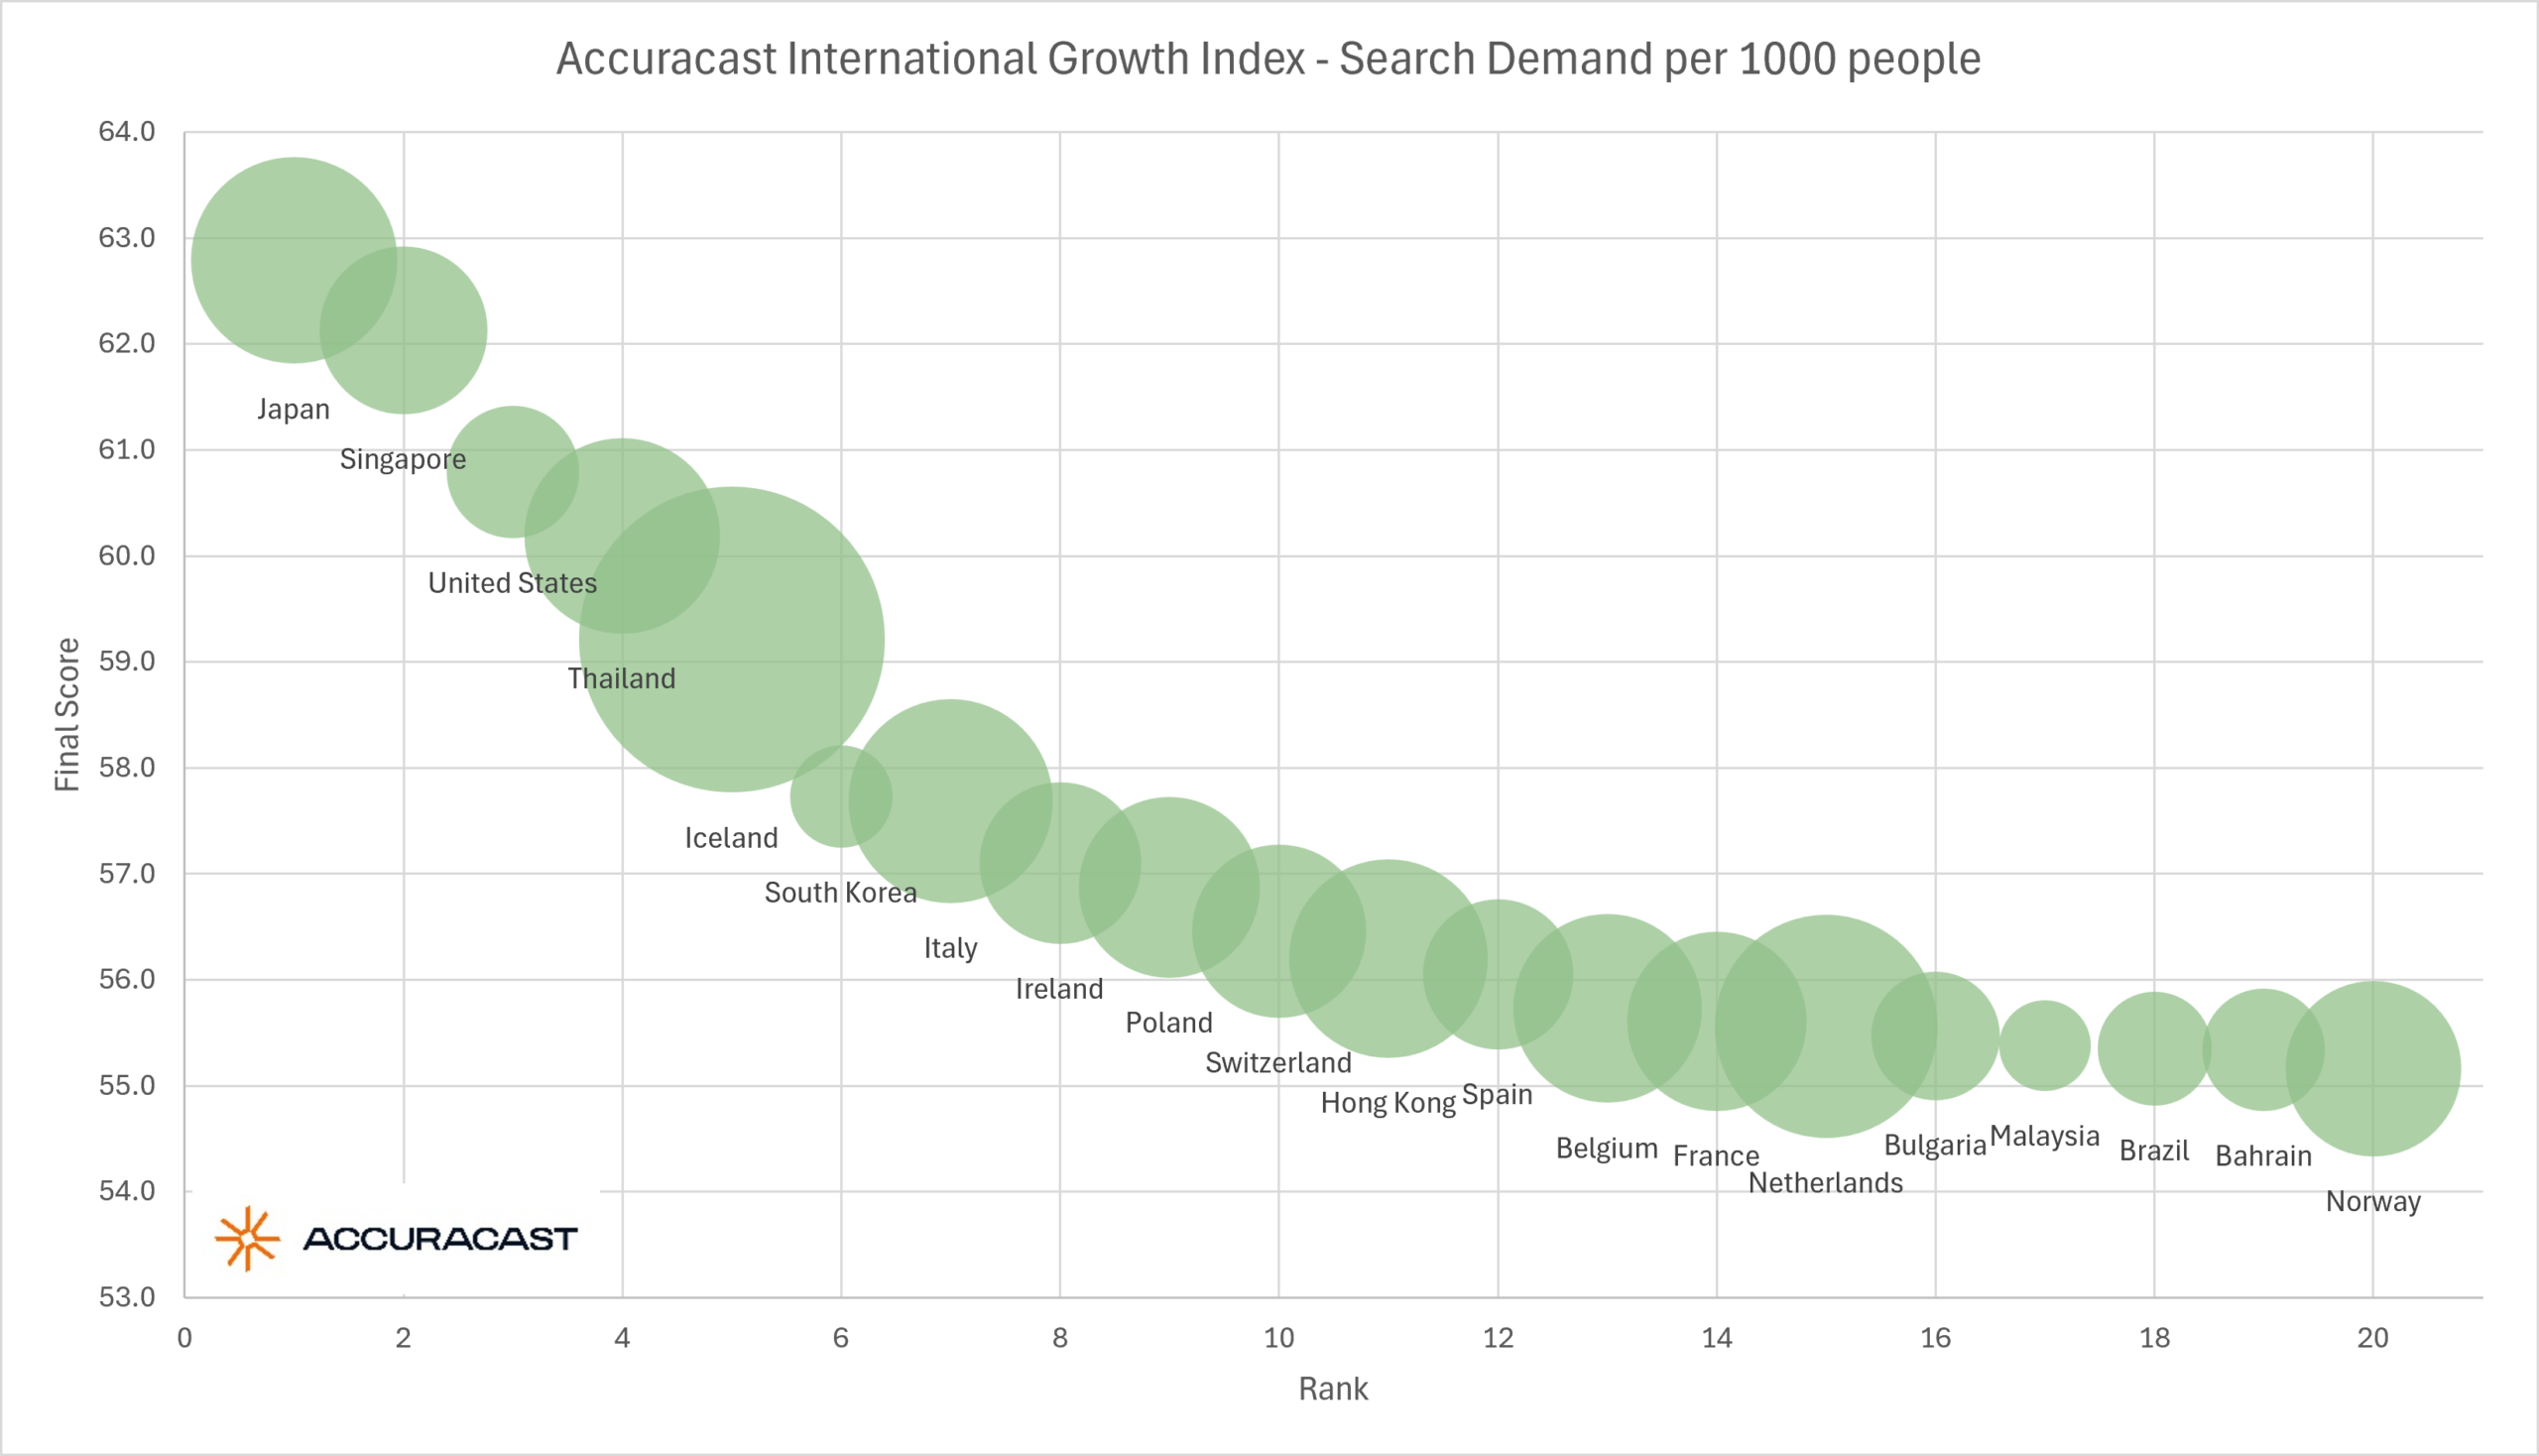
Mouse over individual bubbles to view the country info. Details about the keyword set can be found in the next section.
<> Embed the interactive infographic or static image on your site.
<iframe title="Accuracast International Growth Index" aria-label="Scatter Plot" id="datawrapper-chart-PtAEZ" src="https://datawrapper.dwcdn.net/PtAEZ/4/" scrolling="no" frameborder="0" style="width: 0; min-width: 100% !important; border: none;" height="463" data-external="1"></iframe><script type="text/javascript">(function(){function e(){window.addEventListener(`message`,function(e){if(e.data[`datawrapper-height`]!==void 0){var t=document.querySelectorAll(`iframe`);for(var n in e.data[`datawrapper-height`])for(var r=0,i;i=t[r];r++)if(i.contentWindow===e.source){var a=e.data[`datawrapper-height`][n]+`px`;i.style.height=a}}})}e()})();</script><p style="font-size:13px;">Source: <a href="https://www.accuracast.com/global-growth-lab/international-growth-index/" target="_blank" rel="noopener">Accuracast International Growth Index</a></p>
<p><img src="https://www.accuracast.com/wp-content/uploads/2026/09/Accuracast-search-demand-index-scaled.png" alt="Accuracast International Growth Index — search demand bubble chart" width="800" style="max-width:100%;height:auto;" /> <p style="font-size:13px;">Source: <a href="https://www.accuracast.com/global-growth-lab/international-growth-index/" target="_blank" rel="noopener">Accuracast International Growth Index</a></p>
Data Sources
The International Growth Index uses data from leading global institutions to evaluate market attractiveness and international growth potential based on the economic, regulatory, digital readiness, political risk and search demand data for each country.
Sources include the World Bank’s B-READY project, the IMF World Economic Outlook and IMF economic datasets, the United Nations Population Division, the International Telecommunication Union, UNCTAD and ILOSTAT. Accuracast added Google Ads Keyword Planner data for total monthly search volume, searches per 1,000 people, weighted average CPC and weighted competition.
Data Recency: Market-demand and purchasing-power inputs include 2026 UN and IMF figures alongside the latest available growth, inflation, exchange-rate and labour data. Digital-readiness and World Bank B-READY measures primarily cover 2024–2025, while Google Ads data covers the last twelve months up to the latest quarter.
Google Search Demand Data: Accuracast’s international advertising agency team defined a set of 75 popular English-language search terms, covering financial services, software, technology, professional services, travel, hospitality, sports, fitness, ecommerce and retail. These terms were translated into twenty major global languages and were used in each market to keep the comparison consistent. Google search volumes are platform estimates rather than indicators of total consumer demand, and the language choice may understate demand in some non-English searches.
World Bank B-READY measures were used on their published 0-100 scale. Countries where data was not reported used a weighted average for that pillar. A 5-point penalty is applied within the demand pillar to markets with populations below 1 million, and a penalty of up to 20-points is applied where the model’s political-risk field was marked High Risk. Pillar scores were combined using the weights described in the ranking methodology section.
Full results and the technical methodology are available. Contact us to request access. Further research reports and white papers on cross-border growth are available in the Global Growth Lab.
The index is intended for market screening and does not replace country-specific legal, regulatory or financial advice.
The Eight Pillars
To measure how attractive a market is for business expansion, our international marketing strategy consultants identified eight strategic pillars that influence international expansion success. Each pillar is scored based on a number of contributing factors, which are explained below.
Digital Search Demand
The most important pillar in our ranking. Indicates true, existing digital demand in the market, uniting total search volume for the pre-defined keyword set, normalised search volume for those keywords per 1000 people, weighted average cost per click on those terms and degree of search advertising competition in the market.


Purchasing Power
Indicator of consumer spending power, combining GDP per capita adjusted for purchasing power parity, real GDP growth percentage, inflation percentage measured by the consumer price index, exchange-rate volatility, and percentage unemployment rate within the labour force.
Digital Readiness
Focused on digital business, this metric blends internet penetration percentage, 5G mobile coverage as a percentage of population, and fixed broadband affordability, with the World Bank’s B-READY scores for ICT regulations and internet reliability.


Financial Infrastructure
Maturity and accessibility of financial systems, laws and technology that allow money and assets to flow within the economy. This pillar draws on World Bank B-READY scores for finance quality of regulations, finance e-payments & bureaus, and financial credit access for businesses.
Regulatory Complexity
Inversely-graded score integrating data-protection law status and World Bank B-READY scores for restrictions on foreign firms, commercial court efficiency and fair market practices. Lower regulatory complexity is considered better in most business sectors, except finance and health. A high score here indicates lighter-touch regulation.


Setup Cost & Friction
Indicator of the ease of incorporation and market entry. Combines annual wage levels in USD and a synthesis of World Bank B-READY scores for cost to start a foreign firm, time to start a foreign firm, tax filing time, effective tax rate for business, and hiring & firing flexibility.
Market Demand
The size and growth potential for each market, combining the total population, population growth rate percentage, urban population share percentage, and working-age population (15-59) as a percentage of the total population.


Cross-Border Activity
Measures the country’s readiness for export and import trade and foreign business activity. Amalgamates World Bank B-READY scores for trade regulations, digital customs, and time & cost to trade.
Data for all the metrics contributing to a pillar is normalised on a scale of 0-100, and is combined to calculate a composite score for that pillar, in each country.
Examine country-specific data for each pillar by visiting the individual country overview pages from the list of countries. Remember, this index is designed as a market-screening tool, and you need to carry out additional due diligence when deciding on business expansion and go-to-market strategy.
Ranking Methodology
How 248 countries are ranked based on 8 Pillars, 34 Composite Metrics, and 382k data points
Each of the eight pillars contributing to the International Growth Index is composed of a number of metrics, as described above, that collectively indicate market attractiveness for cross-border expansion. When combining the composite pillar scores to determine the overall score for each country, we apply a weighting system, which is determined by Accuracast’s international growth specialists and data scientists. This section details the resulting ranking methodology.
| Pillar | Weight | Core Focus & Significance |
|---|---|---|
| Digital Search Demand | 30% | The most important ranking factor on Accuracast’s International Growth Index. This metric truly differentiates markets based on attractiveness for digital business expansion. High digital search demand indicates the presence of an audience that is aware of, actively searching for, and will be receptive to finding products and services online. |
| Purchasing Power | 25% | Weighted heavily due to the importance of reaching a local audience that has the financial means to afford products and services. Mass-market product manufacturers from wealthy countries should pay attention to this pillar in countries like Pakistan that have a large population but low purchasing power. |
| Market Demand | 15% | Size influences the attractiveness of a market. Countries like India and China can be attractive expansion targets due to their sheer size. For example, China has over 5 million US-dollar millionaires, making the country a very attractive market for luxury products. |
| Digital Readiness | 15% | This indicator of how connected the population is, matters especially for digital-first businesses that rely on audiences discovering their products and services via online channels. Businesses that rely primarily on search and social media marketing should avoid countries that score low on this pillar, as reaching their target audience will require adapting the marketing strategy significantly. |
| Financial Infrastructure | 5% | This might not be as important for foreign companies entering the market, except if they rely primarily on electronic payment methods. This pillar is an indicator of how easy it is for other businesses in the market to trade with your business. This makes it an especially important consideration for B2B companies. |
| Regulatory Complexity | 5% | Critical for healthcare, financial services and gaming firms, where strict regulation can make it impossible to do business in the market. Heavily regulated markets might also require reengineering your products and services to fit the local laws. |
| Setup Cost & Friction | 5% | Many companies can sell internationally without ever having to incorporate in the local markets. However, this pillar indicates the cost and ease of setting up a presence for companies that need to hire local talent or are required to register and file taxes in the region in order to access the local market. |
| Cross-Border Activity | 5% | Important for companies selling physical goods and services subject to digital tariffs. This pillar indicates the ease of cross-border trade with the country. Regions with high barriers to foreign trade can make your products and services unattractive to local buyers. |
Each non-pass-through metric is converted to a 0-100 min-max score across the markets with available data. Metrics where lower values are better, including cost per click, competition, inflation, unemployment, exchange-rate volatility and setup costs, are reverse-scored.
The overall score, which is calculated by applying the above weighting to the score of each pillar, determines where a country gets ranked compared to other markets.
Use the International Growth Index ranking to quickly identify attractive markets for business growth. We provide a range of international digital marketing services to support your expansion goals.
FAQs
Who Should Use This Index?
Accuracast’s International Growth Index is built to guide both digital marketing expansion and broader business and logistics strategy. Whether you are scaling digital acquisition or planning physical supply chain entry, this index can help you uncover high-opportunity cross-border markets.
The index is meant for business leaders evaluating markets for international expansion opportunities. This includes:
- CMOs evaluating international growth opportunities
- CEOs planning international expansion
- Market entry consultants
- Private equity firms assessing international opportunities
- Global brands considering focus markets
- Scale-up companies reaching a plateau in their current market.
How can businesses use the International Growth Index?
Business leaders can use Accuracast’s International Growth Index to compare markets, identify countries with higher potential, prioritise expansion opportunities, and focus market entry planning.
When evaluating markets for business expansion, a number of factors need to be considered. This index provides a holistic indicator of every country’s business readiness.
What is market attractiveness for international expansion?
Market attractiveness refers to the overall potential of a country as a target market for business expansion. Countries are considered attractive for international expansion when demand for your product or service already exists, the barriers to entry are low, and the degree of local or international competition in the market isn’t prohibitive.
Conversely, countries where there is little to no demand for your products or services, where the infrastructure to support your business doesn’t exist, regulatory burden is too high, or competition is cut-throat, aren’t considered attractive.
Is the International Growth Index suitable for B2B and B2C expansion planning?
Simply put, yes. The International Growth Index incorporates data for a wide variety of businesses. The digital search demand score is based on a wide keyword data-set, which includes a range of B2B and B2C keywords across multiple industry sectors.
What is the difference between market size and market attractiveness?
Market size measures the total available market for your products or services. However, just because a market is large, does not mean it is attractive.
Market attractiveness considers market size, but also weighs that against a number of important factors such as market saturation, competition, and the ease of doing business in the country.
For example, China is a very large market, but it may not be attractive to a business that relies largely on Google and Meta to sell products online, since both those platforms are banned in China.
Why do countries move up or down in the rankings?
Movement in rankings can be influenced by any number of factors that contribute to the overall score.
Since the overall attractiveness scores for many countries are very close together, even slight fluctuations in the economy, digital demand or political landscape can drive changes in the rankings.
How often is the International Growth Index updated?
Accuracast’s International Growth Index is updated quarterly.
While data from the IMF, World Bank, and OECD may be updated once a year, other factors, especially digital search demand fluctuate daily.
In recent years, major political upheaval has also been fairly frequent, leading to further volatility in rankings on the index.
It is therefore important to keep on top of market attractiveness. We believe a quarterly refresh provides the right mix of recency and reliability.
Why is digital search demand important?
Digital Search Demand is a true indicator of actual consumer and business interest in products and services within a country. It is an indicator of both audience awareness and interest in finding products and services online.
What factors contribute to the digital search demand?
Digital Search Demand is one of the key factors differentiating Accuracast’s International Growth Index from any other similar data sets, including the World Bank’s B-READY report.
To calculate Digital Search Demand, our international digital marketing agency team selected a range of keywords across key industries and then polled Google data to measure demand. The score is calculated with the target keyword set based on total search volume, searches per 1,000 people, weighted average cost per click and competition for those keywords.
How can Accuracast help companies grow internationally?
Accuracast specialise in international growth!
We can support your expansion plans through:
Let's solve your biggest challenge
Talk to our specialists about a solution tailored to achieve your goals.