by: Stefano Roberti and Jennifer Mourenza
Unlocking the Power of LinkedIn: How B2B Brands Succeed on Social Media
Social media has become an integral part of any business’s marketing strategy, and LinkedIn is widely considered the most important social network for B2B communications. However, it can be challenging to engage with the right audience on the platform.
As we look to the future, AI and ChatGPT are captivating LinkedIn audiences, but privacy concerns and the availability of customer data are important considerations that are likely to shape the content and marketing strategies of B2B marketers in 2023 and years to come. As a result, building credibility and trust with your audience should be one of your top priorities.
To succeed on LinkedIn, it’s important to have a 360-degree view of your audience. By gathering data and insights on the paid and organic campaigns of major B2B players in different verticals, we can offer a comprehensive view of the social landscape.
- Organic Media
- Organic Media – Verticals in focus
- Paid Media
- Paid Media – Verticals in focus
- Final thoughts
JTNDc2NyaXB0JTNFJTBBY29uc3QlMjBwYXJlbnRMaW5rcyUyMCUzRCUyMGRvY3VtZW50LnF1ZXJ5U2VsZWN0b3JBbGwlMjglMjcucGFyZW50JTI3JTI5JTNCJTBBcGFyZW50TGlua3MuZm9yRWFjaCUyOGZ1bmN0aW9uJTI4bGluayUyOSUyMCU3QiUwQSUyMCUyMGxpbmsuYWRkRXZlbnRMaXN0ZW5lciUyOCUyN2NsaWNrJTI3JTJDJTIwZnVuY3Rpb24lMjhlJTI5JTIwJTdCJTBBJTIwJTIwJTIwJTIwZS5wcmV2ZW50RGVmYXVsdCUyOCUyOSUzQiUwQSUyMCUyMCUyMCUyMGNvbnN0JTIwc3ViQnVsbGV0cyUyMCUzRCUyMGxpbmsubmV4dEVsZW1lbnRTaWJsaW5nJTNCJTBBJTIwJTIwJTIwJTIwaWYlMjAlMjh3aW5kb3cuZ2V0Q29tcHV0ZWRTdHlsZSUyOHN1YkJ1bGxldHMlMjkuZ2V0UHJvcGVydHlWYWx1ZSUyOCUyN2Rpc3BsYXklMjclMjklMjAlM0QlM0QlM0QlMjAlMjdub25lJTI3JTI5JTIwJTdCJTBBJTIwJTIwJTIwJTIwJTIwJTIwc3ViQnVsbGV0cy5zdHlsZS5kaXNwbGF5JTIwJTNEJTIwJTI3YmxvY2slMjclM0IlMEElMjAlMjAlMjAlMjAlN0QlMjBlbHNlJTIwJTdCJTBBJTIwJTIwJTIwJTIwJTIwJTIwc3ViQnVsbGV0cy5zdHlsZS5kaXNwbGF5JTIwJTNEJTIwJTI3bm9uZSUyNyUzQiUwQSUyMCUyMCUyMCUyMCU3RCUwQSUyMCUyMCU3RCUyOSUzQiUwQSU3RCUyOSUzQiUwQSUzQyUyRnNjcmlwdCUzRSUwQSUzQ3N0eWxlJTNFJTBBLnN1Yi1idWxsZXRzJTIwJTdCJTBBJTIwJTIwZGlzcGxheSUzQSUyMG5vbmUlM0IlMEElN0QlMEElM0MlMkZzdHlsZSUzRQ==Our analysis focuses on industry-leading B2B companies and collects information on their strategies, content, and results, comparing them to identify key factors that contribute to their success.
 We looked at essential social performance indicators, such as the number of followers, post engagement in terms of likes and comments, and traffic, as well as content and strategy. By identifying trends in topics that generate the most interaction, posting frequency, and post formats used, we have identified key strategies for success.
Our study analysed five B2B sectors:
- SaaS
- Fintech
- Professional Services
- Finance & Insurance
- Telecom
These sectors were chosen due to their strong growth resulting from favourable strategies and market demand. Importantly, all the comparative data in our study has been normalised per thousand followers, allowing us to provide meaningful data for organisations of all sizes.
In essence, our study allows you to benchmark your success against the brands we’ve studied, whether you have 5,000 or 5 million followers. With our insights and analysis, you can unlock the full power of LinkedIn and succeed on this critical platform for B2B communications.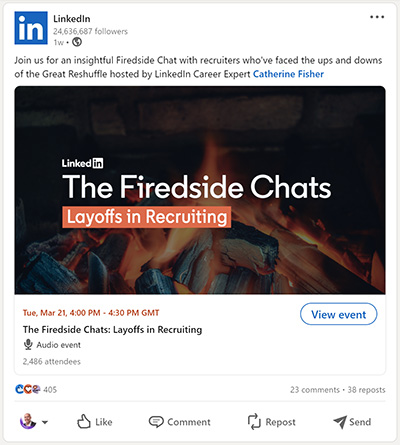 However, for B2B brands, LinkedIn has emerged as a crucial platform to invest in. Similar to other social networks, LinkedIn does not distribute content from company pages to all of their followers.
In fact, brands must pay to reach all of their followers. Despite this, creating engaging content can still result in significant organic reach, which can help businesses generate leads, improve brand recognition, and enhance their brand’s credibility and trustworthiness.
Because LinkedIn only displays organic content to a small percentage of a page’s total following, it is essential to achieve high engagement to increase organic visibility.
Studies have shown that content which gains attention within the first 60-90 minutes of being posted is more likely to be displayed to a wider audience. To assess the success of organic content on LinkedIn, we analysed three key metrics:Engaging with social media content is like striking up a conversation with a stranger at a party – it’s all about making a connection. On LinkedIn, engagement is all about the ways users interact with content, such as clicking to read more, swiping through carousels, watching videos, and liking, commenting on, and sharing posts.
When it comes to engagement, LinkedIn is a standout platform. In fact, our research showed that LinkedIn had the most likes and comments per post compared to all other businesses we studied.
However, LinkedIn also has an advantage because it can prioritise its own content in algorithms that determine when, where, and to whom content is shown. This means that LinkedIn’s own content statistics may not be the most useful for your business.
But don’t despair! By analysing the data, we discovered that certain types of content generate the majority of engagement across all industries. Content related to equal opportunities, social responsibility, and technological advancement were the top performers.
Digging deeper, we found that SaaS companies had the highest engagement rates compared to professional services companies. This is likely due to the industry insights and trending topics like artificial intelligence that SaaS companies often share. Shopify, for example, provides valuable content for its millions of e-commerce users.
On the other hand, companies in the lower engagement verticals did not see the same level of interaction, even when their most popular content was related to equity and social responsibility.
So how can you ensure your content is engaging? It’s all about creating a connection with your audience:
- Share valuable insights
- Highlight your company’s social responsibility efforts, and
- Showcase the latest advancements in your industry.
And remember, likes and comments are important, but they’re not the only metrics that matter. Focus on meaningful engagement with your target audience, and you’ll see your social media presence grow.Consistency is key on LinkedIn, and it’s not just about having a presence on the platform, but also posting regularly to ensure your content is seen by users.
In our study, we analysed the post frequency of 31 companies across various verticals and found that Professional Services had the highest frequency of posts, averaging 34 per week, followed by SaaS with 12 and Finance & Insurance with 9.
However, it’s important to note that posting more frequently doesn’t necessarily lead to more engagement. In fact, when we normalise the data based on account follower numbers, we found that the most frequent poster, McKinsey, did not perform well in terms of comments or likes. On the other hand, Allianz, which posted less frequently, performed best.
Finding the right balance between posting too frequently and too infrequently can be tricky, and it varies across different industries. However, brands can benchmark their posting frequency against others in their market to find the sweet spot.
Remember, just like in real life, showing up consistently is key to building relationships and staying top of mind. So, make sure to keep your LinkedIn page regularly updated with engaging content. On social media, content is king. With the right content strategy, even B2B brands can go viral on LinkedIn, but a lacklustre approach can limit your reach and force you to spend more to engage your audience.
That’s why nailing your content strategy is crucial. When we studied the best performing posts for 31 companies across different industries, we noticed that certain topics appeared time and time again. While the exact topics varied, three themes stood out: gender pay equality, social responsibility, and employee milestones and events.
Gender pay equality is just one of the many equality, diversity, and inclusion (EDI) initiatives your company may be involved in. Highlighting these efforts, whether discussing your current initiatives or promoting future plans, is likely to resonate well with your LinkedIn audience.
Recognising employee milestones demonstrates that you value their contributions and see them as an integral part of the team. It also shows your audience that your company fosters teamwork, values advancement, and has a positive corporate culture.
Finally, events appeared in several top-performing posts, both for events that company representatives attended and events that companies organised. While it may seem obvious, make sure to showcase any events you or your employees participate in!Professional services companies face a unique challenge on LinkedIn. With large followings and frequent posts, their ratio of followers to engagement tends to be lower than other verticals.
However, we found that the most engaging posts in this vertical were static images or short videos, with a focus on events, industry insights, and product benefits.
Tableau was the standout performer in this vertical, with an impressive average of 62 likes and 1 comment per post. They achieved this by sharing content about events and industry insights, as well as highlighting the benefits of their product. Other companies in this vertical can learn from Tableau’s success.
- The average number of likes per post in this vertical is 22 per 100k followers, and the average number of comments is 0.77 per 100k followers.
- One of the key findings we discovered among professional services companies is the importance of relatable content. Sharing quotes about work or general thoughts is a great way to generate engagement, as is content about equity and social responsibility.
The table below lists some of the professional services companies we studied, their normalised engagement rates, posting frequency, and the top three types of content they mostly share:
| Company | Likes per 100k followers | Comments per 100k followers | Posts per week | Types of content |
| AON | 10.81 | 0.10 | 10 | Events, Insights, Employees |
| Mercer | 0.83 | 0.02 | 120 | Insights, Equity |
| PwC | 0.59 | 0.00 | 6.25 | Tips, Insights, Social Responsibility |
| McKinsey | 0.21 | 0.08 | 50 | Insights, Social Responsibility, Events |
As the table shows, AON and Mercer have the highest engagement rates, while Mercer has the highest post frequency. Overall, the companies in this vertical prioritise thought leadership, insights, and events in their content. They also recognize the importance of social responsibility and equity in generating engagement.As we delve into the world of Software as a Service (SaaS), it’s important to consider the strategies that businesses are employing to engage their followers. This vertical has the second lowest ratio of followers to interaction, which means that businesses need to work hard to capture their audience’s attention.
One thing we noticed is that many businesses are incorporating video content into their strategy, with varying degrees of success. While Tomorrow prioritises shorter videos, Shopify tends to focus on longer form content. Microsoft, on the other hand, has only posted two videos and both are under one minute in length.
When it comes to the average number of posts per week, we see that the average for this vertical is 12. Businesses tend to focus on industry insights and events, but they also touch on topics such as social responsibility and equity.
OpenAI stands out as the top performer, with a high engagement rate despite only posting once per week. This business is revolutionising AI research, and their followers are inspired by the conversations they are creating.
Tomorrow comes in second place, with an impressive engagement rate despite posting more frequently. They use a variety of content formats, from static images to polls, to maximise usability.
In contrast, Microsoft is not performing well in terms of comments and likes, despite posting 13 times per week. Their most engaging post is their CEO discussing sustainability.
Across the companies in this vertical, we noticed a trend towards content related to social responsibility and equity. Many businesses are highlighting issues related to race, gender, and salaries, which is clearly resonating with their followers.To get a better idea of how businesses are performing, we analysed the average likes and comments per post per 100k followers.
- OpenAI had the highest likes per post, with 729.74, while Salesforce had the lowest at 1.89.
- In terms of comments per post, the average is 0.5.
- The average likes per post for this vertical is 25.
Here’s a summary of the data for some of the top-performing SaaS companies we studied in the vertical:
| Company | Likes per 100k followers | Comments per 100k followers | Posts per week | Types of content |
| OpenAI | 729.74 | 17.44 | 1 | Industry insights, equity |
| Tomorrow | 596.28 | 5.35 | 40.75 | Events, social responsibility, quotes |
| Shopify | 100.29 | 5.02 | 1.25 | Insights, events |
| Optimizely | 59.01 | 1.04 | 8 | Tips, events, industry insights |
| AppAnnie | 39.80 | 1.56 | 4.25 | Tips, events |
| Hubspot | 30.45 | 1.39 | 4.75 | Equity, company updates, insights |
| Marketo | 13.13 | 0.22 | 1.25 | Trends, insights |
| HP Enterprise | 9.42 | 0.15 | 2.25 | Equity, trends and product updates |
| Salesforce | 1.89 | 0.02 | 50 | Employees, equity, events, and products |
| Microsoft | 0.65 | 0.02 | 13 | Events, social responsibility, equity, product updates |
As shown in the table, OpenAI has the highest engagement rates, while Microsoft has the lowest. The average number of likes per post per 100k followers is 25, while the average number of comments per post is 0.5. Companies that inspire their followers with groundbreaking technology and ideas tend to have the highest engagement rates.
Additionally, companies that use a variety of content formats and topics tend to have higher engagement rates, despite posting more frequently.In the world of telecom, where connectivity is key, social media plays a crucial role in keeping customers informed about the latest news, updates, and products. But with so much competition, what sets apart the best performers from the rest?
According to our analysis, GoDaddy is the clear winner in this vertical. They use more video content than their competitors, with all videos being exclusively under one minute. Their top-performing post is about creating branding that truly connects with customers. However, their posting frequency is not consistent, and they often go through periods of no activity.
Vodafone, on the other hand, is the most active in the vertical, posting an average of 15 times per week. While they also use a wide range of video content, their mix includes both videos under and over one minute in length. However, their performance in terms of comments is lacking, making them the worst performer in that category.
AT&T falls in the middle of the pack with an average of 10 posts per week. Their content focuses on employees’ milestones, equity, company updates, and events, but their performance in both likes and comments is the lowest among the three companies.
When it comes to engagement on social media, it’s not just about the number of posts.
- Our analysis found that the average likes per post for 100k followers is 18.
- While the average comments per post for 100k followers is 0.6.
One interesting trend we noticed across all companies in this vertical is that they avoid creating commercial content. Instead, they focus on developing content about their workforce, equity support, and events that may help other members on their projects with a different perspective that can be very useful. This approach exemplifies their corporate culture and values.To summarise our findings, we’ve created a table that compares the performance of GoDaddy, Vodafone, and AT&T:
| Company | Likes per 100k followers | Comments per 100k followers | Posts per week | Types of content |
| GoDaddy | 103.74 | 6.84 | 1.25 | Social responsibility, employees’ updates, tips, and equity |
| Vodafone | 17.99 | 0.28 | 15 | Industry insights, employees’ milestones, events |
| AT&T | 13.98 | 0.62 | 10 | Employees’ milestones, equity, company updates, and events |
LinkedIn is a powerful tool for telecom companies to promote their brand and connect with their audience. By focusing on video content, corporate culture and values, and a varied content strategy, you can improve your social media performance and stay ahead of the competition.In our study, B2B finance and insurance is the vertical with the greatest scope for improvement, averaging 20.2 likes and 0.2 comments. However, Allianz is the best performer in this category, with the highest number of comments and likes for their audience size.
They use a lot of videos in their content, with 11 of their last 20 organic posts being videos, five of which are short and six long. They also use a mix of post types, incorporating videos, images, and documents.
Another company to look at is Prudential, which has four out of 20 posts being short videos, and they do not use document ads. On the other hand, EY has the worst performance for likes, while WTW has the lowest number of comments.
WTW uses a mix of short and long videos, with five out of their 20 posts being long videos and two short ones. Meanwhile, EY uses more short videos, with six out of their 20 posts being short and only one being long.
While there is no clear relationship between video length and performance, it is recommended to vary post types to identify what your audience responds to and to prevent content fatigue.
- The average number of likes per post for 100k followers in this vertical is 20.
- While the average number of comments per post for 100k Followers is 0.27.
In terms of common trends and habits across the companies in this vertical, there is a focus on highlighting the usability of their products.To study social media performance of traditional financial services and insurance businesses, we once again analysed the average likes and comments per post per 100k followers. The table below summarizes data for some of the top-performing companies we studied in the vertical:
| Company | Likes per 100k followers | Comments per 100k followers | Posts per week | Types of content |
| Allianz | 156.21 | 2.09 | 4 | Job positions, company updates, insights, and social responsibility |
| Prudential | 63.47 | 0.67 | 3 | Products, equity, and events |
| HSBC | 33.81 | 0.48 | 2.5 | Equity, company updates, and social responsibility |
| Marsh | 30.74 | 1.60 | 16 | Insights, events, and equity |
| Citigroup | 15.34 | 0.16 | 14 | Equity, events, and products |
| KPMG | 8.08 | 0.06 | 13.75 | Company updates, job opportunities, events, and awards |
| EY | 5.95 | 0.06 | 10.75 | Social responsibility, job opportunities, and industry insights |
Don’t let the low engagement rate in this vertical discourage you. By adopting a diverse content strategy that showcases your product’s usability and highlights your company’s social responsibility, you can increase engagement and make a lasting impression on your audience.As we delve into the world of fintech, we can see that Monzo and AmEx (even though America Express is an established brand, their alliances with tech qualify them as a fintech pioneer in many ways) stand out as the top performers, with their well-known brand images and easy-to-digest content. Both companies have an impressive number of likes per 100k followers, with Monzo leading the pack at 309.33 and AmEx following closely behind at 54.33.
Interestingly, neither company posts video content, but this hasn’t hindered their success. However, when we look at the worst-performing company in this vertical, Revolut, we see that they also don’t use video content, but their engagement rates are significantly lower.
- On average, the number of likes per post for a 100k follower is 67.2.
- The average number of comments per post is 1.78.
This indicates that engagement rates in the fintech industry are relatively low, but Monzo and AmEx have managed to defy the odds and achieve high levels of engagement.
When we look at the types of content used by companies in this vertical, we can see that they tend to use content created by others, such as reposts, company updates, and insights. However, the frequency and style of these posts vary among the different companies. Wise, for example, posts about their products, while Revolut focuses on events and company milestones.Let’s take a closer look at the key stats of the companies we’ve discussed in the table below:
| Company | Likes per 100k followers | Comments per 100k followers | Posts per week | Types of content |
| Monzo | 309.33 | 13.79 | 5.5 | Company updates, insights and jokes, repost content |
| American Express | 54.33 | 0.52 | 5.5 | Insights, employees and social responsibility |
| Wise | 9.06 | 0.02 | 6 | Products, repost content and company updates |
| Revolut | 2.23 | 0.00 | 4.75 | Events, company milestones, reposting content |
The FinTech industry is evolving rapidly, and companies need to be strategic in their approach to engage their audience. Monzo and AmEx have shown that a strong brand image and easy-to-digest content can lead to high levels of engagement. However, it’s also important to experiment with different types of content and posting frequency to find what works best for your audience.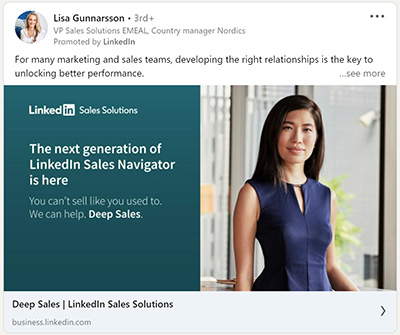 While organic social media can be effective, relying solely on it is not enough to guarantee success. This is where paid media comes in.
LinkedIn Advertising is a powerful platform for businesses, particularly those in the B2B space. With over 645 million professionals using the platform, it presents a unique opportunity to reach your target audience. What’s more, LinkedIn is the only platform that allows advertisers to target audiences based on their job and company details, making it the perfect fit for B2B marketing campaigns.
However, the reality is that organic reach on social media is declining as platforms prioritise a more “responsible” user experience. As a result, only a small percentage of a brand’s followers will see their organic posts.
For example, the average organic reach for a Facebook post is about 5.5% of the follower count, and for popular brands with large followings, it’s often less than 5%. This trend is expected to continue as the world’s biggest social media platforms reach saturation.
So, how can businesses maximise their reach on LinkedIn? By investing in paid media. Promoting your content through advertising lets you reach all your followers, and even audiences who aren’t yet aware of your brand. With targeted ads, you can ensure that your message is seen by the right people at the right time.
But how do you measure the success of your paid media campaigns? It’s crucial to understand which stats and key performance metrics (KPIs) are worth paying attention to. The table below shows three fairly easy to measure reach & engagement metrics for a couple of well-known brands.
| Company | Followers | Likes per paid post (normalised) | Comments per paid post (normalised) |
| 24,402,015 | 123.13 | 2.59 | |
| Tableau | 820,394 | 15.52 | 0.10 |
While a lot more should be measured behind the scenes of any ad campaign – clicks, costs, lead volumes – it is important to keep in mind that LinkedIn is a social network, and even on the advertising front, great engagement will always deliver better results.Engaging your target audience is crucial for the success of any advertising campaign. When it comes to LinkedIn ads, measuring engagement rates is a great starting point to understand how your brand is perceived by your audience. The number of likes, comments, shares, and reactions that your ads receive can tell a story about your brand’s performance on the platform.
For B2B brands, understanding and benchmarking performance against these engagement metrics can help better manage social campaigns, drive traffic and conversions, increase followers, boost brand awareness, and generate more website traffic.
Interestingly, LinkedIn advertising statistics suggest that paid posts with images tend to receive more likes than organic posts without images. So, it’s essential to include an image with each post to increase engagement rates.
While it’s commonly believed that videos get more engagement than single images, a 2020 study by LinkedIn found that images had a higher click-through rate than videos. In fact, the click-through rate for an image ad was 25%, while for a video ad, it was only 16%. Therefore, it makes more sense for brands to use custom images to drive brand awareness and clicks to their website.
Custom images, which feature 3-4 images in one post, can perform exceptionally well. They provide users with more visual context and can help expand your reach. By paying attention to these engagement metrics, B2B brands can improve the effectiveness of their LinkedIn advertising campaigns and achieve better results.When it comes to creating high-performing ads on LinkedIn, it’s important to consider the type of sponsored content you’re using. With six different formats to choose from – single image, carousel, video, event, document and message – it can be challenging to know which one will resonate best with your target audience.
Many brands like to experiment with different formats to see what works best for their core audience. Single images are often used to promote products or services, increase brand awareness, or drive traffic to new documents. Document ads, on the other hand, allow businesses to showcase whitepapers, eBooks, or case studies by displaying a preview of the document and linking to the full version.
In our analysis of LinkedIn advertising statistics, we found that single images and videos are the most commonly used types of creative. When it comes to content, brand awareness remains king on LinkedIn. Unlike other social media platforms where users primarily seek entertainment, LinkedIn is a place where people stop to read interesting news and articles.
Sharing articles is one of the most popular forms of engagement from paid activity, falling under the Brand Awareness umbrella of valuable LinkedIn paid practices.
Another common way paid ads are used is to promote job vacancies.
Lead generation comes third in terms of content brands are putting spend behind. We found that whitepapers and brochures are widely promoted content types across industries on LinkedIn.
Overall, by understanding which types of sponsored content perform best on LinkedIn, businesses can better target their advertising efforts to reach their desired audience and achieve their marketing goals.The Professional Services industry has always been on the forefront of adapting to the changing digital landscape and reaping the benefits. And their success story with paid LinkedIn ads is no exception.
The highly professional audience of LinkedIn ads makes it an obvious choice for this industry. And it shows in the data too. The paid ads of Professional Services companies receive nearly triple the number of comments compared to other industries.
- Avg. Comments per 100k followers 1.72
But what makes their strategy stand out? It’s their keen attention to detail and a well-rounded approach that ensures the desired outcome. They start by participating in relevant conversations and showcase their brand image through top-of-funnel activities.
Consistency is the key, so they post and sponsor regularly to create a dialogue. They constantly monitor trends and performance, and if something is not working, they quickly pivot to the next strategy.
Engaging with their audience is another top priority. They re-share content, and leverage focused paid activity to promote important posts.
The numbers speak for themselves. Professional Services companies are dominating the LinkedIn advertising game.Let’s take a look at some of the top players in this industry and their performance on LinkedIn Ads:
| Company | Followers | Likes per paid post (normalised) | Comments per paid post (normalised) |
| Mercer | 635,960 | 6.78 | 0.00 |
| PwC | 4,947,904 | 2.37 | 0.03 |
| AON | 1,127,077 | 2.32 | 0.01 |
| McKinsey | 5,029,184 | 2.04 | 0.06 |
As you can see, from the previous table and the one above, LinkedIn is at the top of the list, with an impressive 123.13 likes per promoted post and an average of 2.59 comments per paid post. Tableau and Mercer have significantly lower engagement rates on their ads, but they still have a strong presence on LinkedIn. Their attention to detail and focus on engaging with their audience are the key factors that have contributed to the success of their promotions on the platform.Looking into the Software as a Service (SaaS) industry, it’s clear that big brand SaaS companies are leading the way with an impressive average of 3 million LinkedIn page followers. To understand industry trends and how LinkedIn paid ads are being used, we’ve identified some interesting data points.
- One key finding is that the average likes per post for SaaS companies is 16.2, which is very good for paid activity and places them among the most ‘liked’ sectors on average.
To achieve this level of engagement, SaaS companies focus on creating content that addresses their prospects’ pain points, such as white papers, eBooks, brochures, and other valuable resources.
By offering this sponsored content, SaaS brands can create new relationships with prospects and build trust by demonstrating their knowledge. In fact, the data shows that LinkedIn Lead Gen Forms are an effective way to get hot leads into the sales funnel. These forms automatically populate with data from a prospect’s LinkedIn profile, making it easy to send relevant information into a brand’s CRM.
We’ve also noticed a common trend among SaaS companies, with many adopting a testing-first approach. This is a safe bet on LinkedIn and allows brands to experiment with different kinds of content to see what resonates with their audience.To illustrate this further, we’ve included a table showing the number of followers, average likes per post, and average comments per post for some of the top SaaS companies:
| Company | Followers | Likes per paid post (normalised) | Comments per paid post (normalised) |
| Hubspot | 869,026 | 106.05 | 3.51 |
| AppAnnie | 115,068 | 37.72 | 1.04 |
| Optimizely | 81,857 | 15.39 | 0.00 |
| Marketo | 178,633 | 3.36 | 0.00 |
| Salesforce | 4,272,890 | 3.07 | 0.01 |
| Shopify | 689,682 | 3.06 | 0.13 |
| HP Enterprise | 5,175,776 | 0.26 | 0.00 |
| Microsoft | 18,947,141 | 0.24 | 0.00 |
Companies like Hubspot are leading the way with an average of 106.05 likes per post and 3.51 comments per post, while others like Microsoft have lower engagement rates.
By focusing on creating valuable content and adopting a testing-first approach, SaaS companies can succeed on LinkedIn and build strong relationships with their prospects.B2B finance and insurance companies can leverage the power of LinkedIn to establish their brand identity, showcase their products or services, and establish themselves as thought leaders in their industry.
By adopting various strategies such as customer service, lead generation, recruitment, and improving their SEO, companies can create engaging content that helps solve their prospects’ problems.
The younger generation of LinkedIn users, especially Gen Z and Millennials, expect authenticity and transparency from the brands they follow. When it comes to B2B finance and insurance, there is a high like-per-100k count, making LinkedIn one of the best platforms to engage with both existing and prospective customers.
- With an average of 6.7 likes per 100k followers, B2B finance and insurance companies can make their mark on the platform.
Visual content, such as images and videos, is the preferred medium for B2B finance and insurance clients on LinkedIn. These types of content work best across all social media platforms, enabling companies to capture their audience’s attention quickly and effectively.
By analysing the common trends and habits of companies in this vertical, we see that LinkedIn is an effective channel for B2B brands to become trusted sources of industry insights. Brand awareness posts, exceeding 80% of the posts analysed, reveal that companies are actively working to engage with their followers.To illustrate the point further, we’ve compiled a table of some of the companies in this vertical and their average likes and comments per post on LinkedIn:
| Company | Followers | Likes per paid post (normalised) | Comments per paid post (normalised) |
| Allianz | 801,952 | 84.23 | 0.66 |
| HSBC | 3,210,469 | 9.88 | 0.31 |
| Citigroup | 3,986,279 | 6.71 | 0.06 |
| KPMG | 3,179,012 | 1.46 | 0.00 |
| Prudential | 298,429 | 1.01 | 0.00 |
| EY | 7,192,526 | 0.33 | 0.00 |
| Marsh | 508,154 | 0.06 | 0.00 |
B2B finance and insurance companies can benefit greatly from LinkedIn’s various features and functionalities to create compelling content, engage with their audience, and establish themselves as thought leaders in their industry. However, as the data above shows, the degree to which top brands in the industry succeed at doing so, varies greatly.As a content marketing tool, LinkedIn is an especially appealing option for reaching business professionals in the FinTech industry. With the right strategy in place, you can establish yourself as a thought leader and earn the trust of your target audience.
But how can you create content that adds value without coming across as a hard sales pitch? The key is thought leadership. The big players in FinTech are investing heavily in creating informative, relevant, and interesting content that positions them as authorities in the industry.To measure the effectiveness of your content, it’s important to track engagement metrics like likes and shares.
- In the FinTech sector, paying to promote content is more common than in other industries, with players like American Express and Wise getting a lot of shares on their ads.
- However, likes are harder to come by, with an average of just 12.06 per post.
When it comes to running ads, consistency and variety are key. FinTech pages that run ads regularly and mix up their content have 3x more followers than those who only publish ads once a month.
To give you an idea of how different FinTech brands are performing on LinkedIn, here’s a table of their followers and average engagement per post:
| Company | Followers | Likes per paid post (normalised) | Comments per paid post (normalised) |
| Wise | 227,447 | 33.37 | 2.37 |
| American Express | 1,827,625 | 2.47 | 0.41 |
| Revolut | 616,048 | 0.42 | 0.00 |
The data shows Wise is a clear leader in terms of engagement, with an average of 33.37 likes and 2.37 comments per post. American Express and Revolut have lower engagement rates, with American Express averaging 2.47 likes and 0.41 comments per post, and Revolut only averaging 0.42 likes per post.
If you want to succeed in the FinTech industry, it’s crucial to invest in thought leadership and high-quality content on LinkedIn. By doing so, you can build trust and credibility with your target audience and establish yourself as a leader in the industry.As a B2B company, starting out with paid social media can feel like you’re shouting into the void. It can be challenging to reach your target audience, especially in the telecom and IT industries. However, don’t despair. LinkedIn is the solution to your problem, and telecom companies are proving that with their impressive presence on this platform.
Networking and sharing company and partnership updates are the go-to tactics for telecom companies, and they’re reaping great rewards. They’re discussing industry trends and taking notes from what works for other companies.
Their enthusiasm for paid social media is commendable, and their focus on article sharing, linking to educational blogs on their websites, is helping them achieve their goals.
With LinkedIn’s organic reach, their efforts are paying off, and they’re generating engagement with their target audience.
However, telecom companies need to improve their share per post on LinkedIn.
- Although the average like per post (normalised) is 6.1, the average share per post is only 0.2.
They need to make their presence felt and establish themselves as thought leaders in their industry. But how can they achieve this?We’ve compiled a table of the most common trends and habits we’ve observed on LinkedIn for the Telecom industry:
| Company | Followers | Likes per paid post (normalised) | Comments per paid post (normalised) |
| GoDaddy | 111,141 | 67.48 | 4.95 |
| AT&T | 1,638,743 | 8.78 | 0.11 |
| Vodafone | 2,047,290 | 0.46 | 0.03 |
Telecom companies can achieve great engagement on LinkedIn, but starting out can be daunting, particularly for new and less established brands. However, it’s crucial to remember that social media is an extension of your brand.
By making your voice heard on LinkedIn, you can reach more potential customers and partners, and ultimately drive growth in your business.Our analysis of paid activity from selected B2B companies on LinkedIn has revealed some interesting trends and insights. Professional services, B2B Finance and Insurance, and SaaS industries have emerged as the most engaging on the platform, with job listings, brand awareness, and lead generation as the top-performing types of posts.
Video content is not as prevalent on LinkedIn as it is on other platforms, and article sharing remains a popular source of engagement. However, we noticed that inclusion and diversity in creative choices can significantly improve brand favourability, with almost 60% of LinkedIn users being between 25 and 34 years old.
One of the most significant takeaways from our analysis is that LinkedIn is still the top platform for recruitment, with job offers and position advertising being the primary focus of paid ads. Cross-border growth is another important focus, with language targeting being used by 70% of the companies we studied.If you’re looking to enhance your B2B LinkedIn marketing strategy, consider partnering with AccuraCast. With our expertise in LinkedIn marketing, we can help you develop a data-driven approach to improve your engagement rates and reach your target audience effectively. Contact us today to learn more about how we can help you succeed on LinkedIn.
About the Authors

Stefano is a digital marketing consultant at AccuraCast, in charge of developing and executing effective digital marketing strategies to help clients achieve their business goals. His specialities include analysing data, digital strategy planning and teamwork.

Jennifer is a dedicated digital marketing consultant at AccuraCast, specialising in crafting innovative strategies to help businesses grow and succeed online.