![Use Big Data to Discover Factors Influencing Marketing Performance [Step 4]](https://www.accuracast.com/wp-content/webp-express/webp-images/doc-root/wp-content/uploads/2017/06/data-analyst.jpg.webp)
This is the fourth of a 5-part article on how regular marketers can use Big Data to improve campaign performance. If you’ve missed the first three steps, you should start here. In the first part we looked at ways to access data and segmenting it. In the second part we learned how to analyse big data. And in the third part we began identifying market trends with Big Data. Here we will look at ways to discover core factors that influence your marketing performance.
Step 4: Try to pinpoint causes
It isn’t always easy to categorically identify a specific event that led to a change in results. A quick review of your campaign’s key performance indicators (KPIs) may allow you to spot obvious causes, such as increased activity on a particular keyword, or changes to ad creative that resulted in a change in campaign output. However, situations may often arise where the origin of the change is not as easy to pinpoint, and needs further investigation.
Review changes to settings
Common sense dictates that the first port of call should always be a review of your own campaign settings – specifically changes that were made to the account, targeting, bids, or exclusions. The easiest factors to identify are changes you or your colleagues made on your own campaigns. Identifying the agent of change in such a situation requires three simple steps:
- Isolate the points of change
- View performance over time to identify the starting point
- Review changes you made just before that time
To illustrate this process with an example, consider an AdWords campaign where you see cost per conversion increased greatly compared to the previous month. When analysing the root of this change in performance, you should start drilling down in your account to isolate the change down to the lowest level – was it a particular campaign? was the change most obvious in a particular ad group? or can you pin it down further to one or a few keywords?
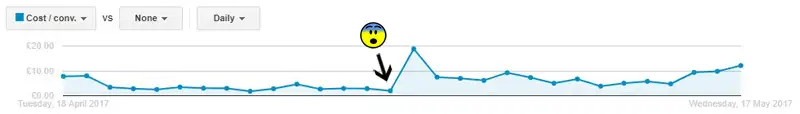
Once you’re at the lowest level where the change is distinctly visible, chart out performance of the single most important metric you’re tracking over time (in this example, the cost per conversion). If you can pinpoint the date when it started increasing, then you can establish a relatively specific starting point.
All you have to do then is review your change history to see what updates might have triggered the change in performance. These may be as simple as a raised Max CPC bid, or a change in keyword matching type from phrase to broad match. The image below shows how you can view change history in the new AdWords interface.
Isolate contributing factors
In situations where your own alterations or updates do not explain the change in campaign performance, you need to follow a similar three-step process to identify the prime mover.
- Isolate the points of change
- View performance over time to identify the starting point
- Isolate the contributing factors
Here too, you should start by drilling down to the lowest level where the change in performance is evident. You then need to view performance of your main KPI metric over time to pinpoint when the performance deviated from its regular value.
Once you’ve identified the fundamental changed element and the starting point, you should isolate potential influencers. This process requires a mix of experience, data segmentation, and logical thinking.
Start by segmenting your data to analyse two levels of data at a time, looking at potential causes and their effects. These causes can be a combination of any factors that your experience tells you could have an impact on performance. Common segment pairs that may be analysed include target and creative, or time and price, or target and competition. The table below illustrates some factors that may be considered for such an analysis with popular marketing channels:
| Channel | Target | Creative | Price |
|---|---|---|---|
| Demographic | Sponsored post | Cost per like bid | |
| Newsletter subscribers | Email text | Cost per send | |
| Display | Affinity audience | Leaderboard image | CPM bid |
| Search | Keywords | Ad title copy | CPC bid |
When analysing the data, you need to look out for combinations of factors that consistently deliver a different level of performance. For example, you might notice that a group of sponsored posts targeting 18-24 year old males had very low engagement, resulting in a progressively higher cost per like, which started skewing the net campaign’s CPL. Or you might find that a particular audience group had a very high frequency of display ad views, which resulted in decreasing click-through rates, and eventually led to higher CPMs.
Analysing performance data on at least two levels is important in such situations, because looking at any element and a single factor in isolation could lead to a misguided conclusion. On the flip side, trying to look at too many elements and factors at once can often normalise performance dips and spikes and lead to marketers overlooking problems.
Verify seasonality and repetition
User behaviour often repeats at certain times of the year. These seasonal repetitions, though, may not always be as obvious as Christmas or the summer holidays. It is usually a good idea to compare performance to the same period in previous years to identify phases when changes in performance are repeated.
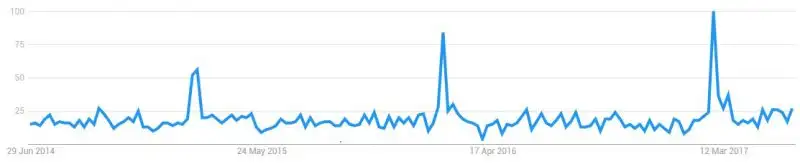
An excellent example of such seasonality was recently uncovered for the travel industry on the Costa Del Sol in Spain. A spike in reservations was seen during one particular period. Analysing search traffic and clicks showed a similar bump in interest during the two previous years. Segmenting the data revealed that a lot of the traffic and consequent reservations during this span came from the Netherlands. Investigating this further led to the discovery that a group of Dutch hiking enthusiasts had organised a 4-day event in the region a few years ago, which had gained popularity and attracted more and more hikers, resulting in a steady rise in demand for services from those tourists, specifically around the time of the event, as can be seen in the graph below.
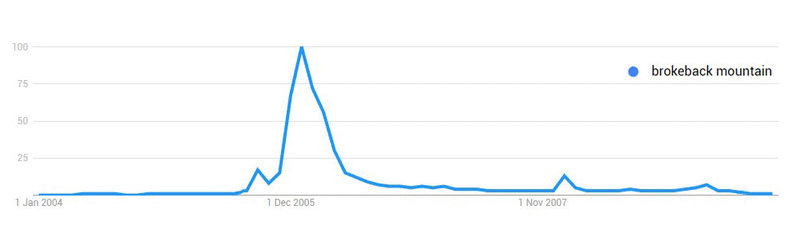
Of course, correlation does not always imply causation. There are times when seasonality, repetition, or coincidental timing cannot be explained sensibly, and might just leave us wondering what goes on in the minds of our fellow humans, as the next, rather hilarious, graph shows.
Identify external influences
Not all changes seed from within the campaign. Very often marketers find that their campaign’s performance may be affected greatly by outside forces that are beyond their control. Common scenarios where external factors wreak havoc on campaigns are changes in legislation such as a product being declared good for health, news coverage such as negative publicity surrounding a brand, social trends such as fads started by YouTube influencers, and major changes in the competitive landscape such as a big player going out of business.
While many external forces may themselves be beyond your control, understanding their effect on your campaign performance can help you adjust settings to compensate for them, change tact to circumvent them, or simply prepare for their recurrence.
In the case of changes in legislation, for instance, savvy marketers can educate users about their options and quickly start promoting alternate products or services. If a brand or industry is hit by negative publicity, effective marketing campaigns can address the issue and/or highlight positives around their brand. Social trends can be capitalised on by piggy-backing on the influencers’ popularity. And changes in the competitive landscape can be exploited to quickly win business away from other competitors (like the advertisers in the image below did when Low Cost Holidays filed for bankruptcy).