Sep 22, 2022
The Problem with Data-Driven Attribution
At what point does it stop being accurate enough?
Digital marketers have seen all the major ad platforms gradually introduce data-driven attribution into their conversion measurement over the course of the past couple of years. The motivation for this has been to preserve performance tracking, which is very important for the platforms to show their value, when traditional tracking methods are lost due to Apple’s ATT framework and third-party cookie deprecation.
But there is a fundamental issue with data-driven attribution…
When cookie-based conversion tracking started getting restricted, businesses with technical and monetary resources implemented server-side tracking to preserve their ability to accurately measure performance. Businesses without in-house technical resources or the funds to pay for analytics and data specialists are left unable to implement technical tracking changes.
Ad platforms provided fairly accurate conversion data historically
Both Google and Meta knew a large number of small and medium businesses wouldn’t have the resources to set up advanced conversion tracking. That is why they started using modelled data to estimate lost i.e. untracked conversions. A degree of modelling was used historically to estimate cross-device conversions and conversion loss due to blocked scripts and tracking / ad blockers. This was fairly accurate because nearly 90% of conversions were accurately tracked, and the models only had to bridge the gap for the missing 10%.
Attribution modelling now relies on smaller data sets
The next bit dives into fairly technical statistics, but it’s important for marketeers to understand. A Guinness brewer named William S. Gosset’s work inspired the concept of statistical significance when he discovered t-distribution curves.
In simple terms, when statistics are applied on large data sets, the results are more reliable and the expected (modelled) results closely match the actual numbers. In the graph below, this is represented by the blue Z distribution curve, which signifies results that do not deviate largely. However, when statistical models are built on a very small data set, they’re less reliable, and the actual numbers can deviate greatly from the modelled data – as seen in the t-distribution curve with a small sample size.
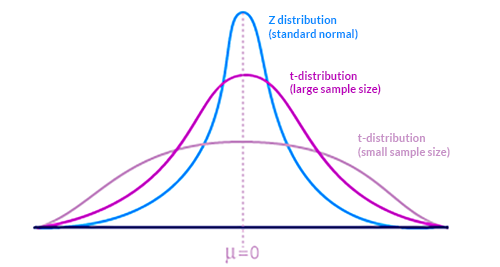
Graph via Columbia University.
Real world examples of this in action are familiar to all of us – where advertisers see a sale reported, but there hasn’t been any. This can be due to algorithms modelling conversions and predicting, based on data and conditions a clicked occurred in, that a conversion should have happened.
When actual conversion volumes tracked reduce, due to the aforementioned changes to privacy management and third-party cookies, more conversion reporting will be based on modelling untracked data. The reliability of that information will reduce drastically.
How to improve performance data accuracy
To optimise campaign performance, you have to reduce the platforms’ reliance on data-driven attribution models and provide them more reliable data. The best way to do so is to combine server-side event tracking with advanced audience matching.
Get future insights like this, in your inbox
Subscribe to get Accuracast’s monthly marketing insights, along with access to new whitepapers, and occasional event invitations. Sign up using the form alongside.